Measured, not asserted
We measured it against a real Wurlitzer 200A
Plenty of Reeds is modeled (modal synthesis), not sampled. To keep the model honest, every per-note render is compared against a real Wurlitzer 200A — the Pifinger sample set — across partial tuning, decay, attack envelope, tremolo depth, and velocity timbre. The numbers below come straight out of the analysis scripts in spectral_analysis/; nothing here is rounded in the model’s favor.
The numbers
The plots
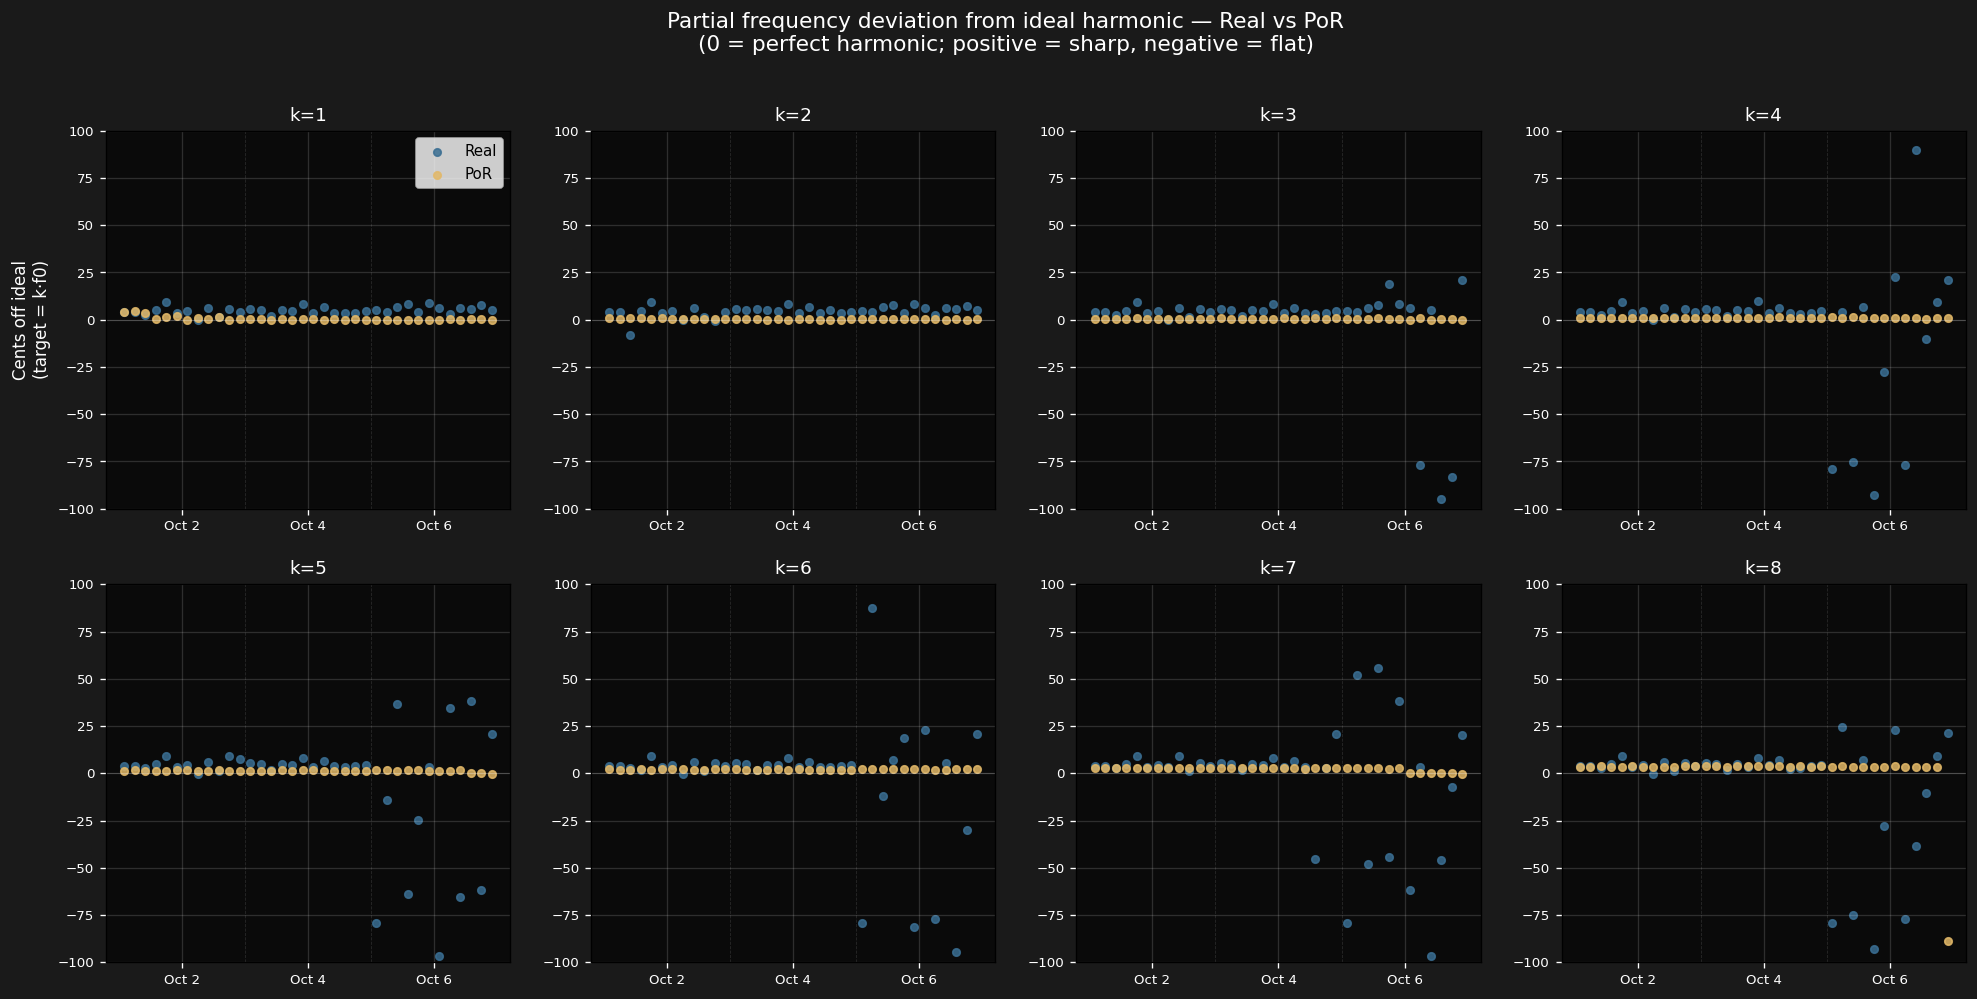
These are the actual measurement artifacts rendered by the analysis suite — real Pifinger 200A (reference) overlaid against Plenty of Reeds (PoR).
spectral_analysis/spectral_match_summary.txt.
spectral_analysis/compare_full_summary.txt.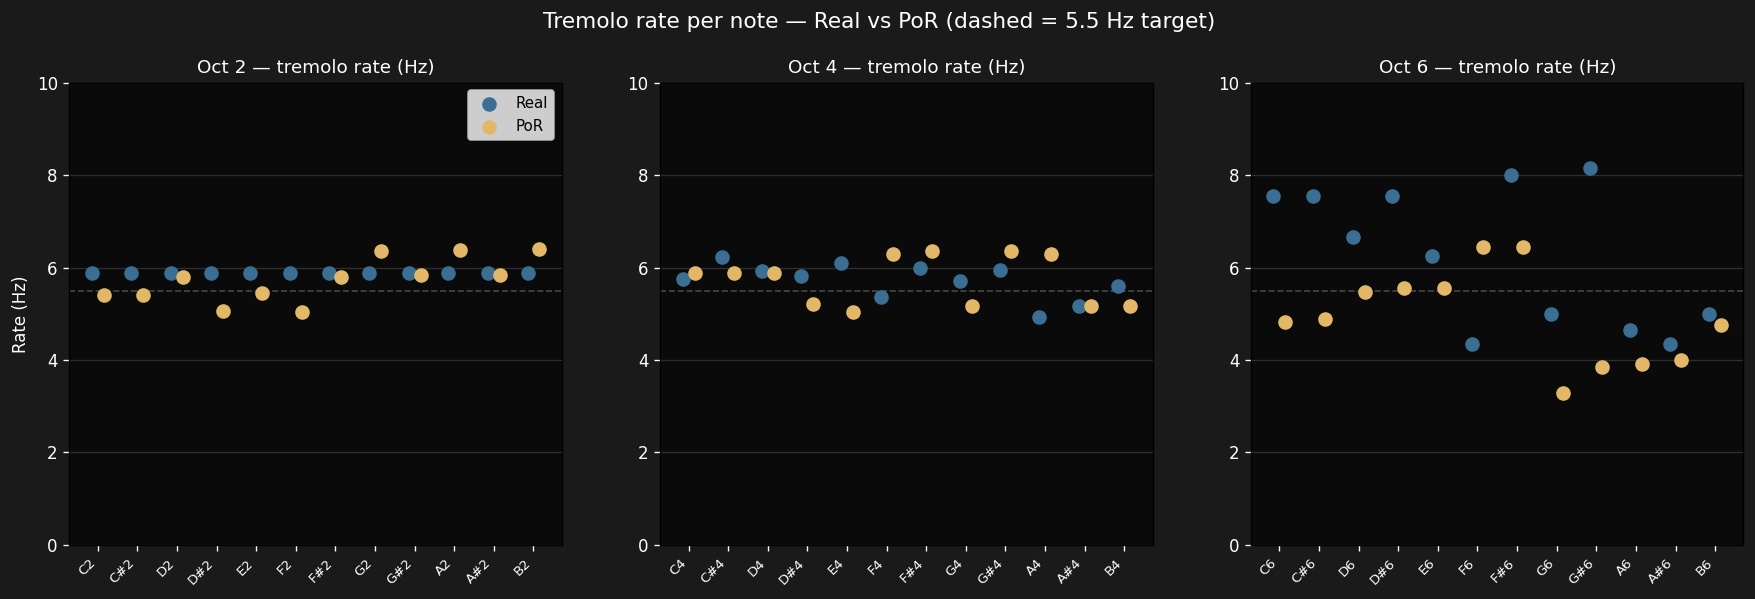
spectral_analysis/measure_tremolo_depth.py.Where the model falls short
No model is the instrument. Two gaps are known, measured, and deliberately left visible rather than papered over:
- Bark dynamics: +15 dB vs +18 dB. The real 200A grows ~+18 dB of upper-harmonic energy from a soft hit to a hard one; the model reaches +15 dB. The shortfall is a modal ceiling — pushing the velocity→timbre law (
kVelTilt = 0.38) harder to close the last 3 dB starts to cost mid-velocity centroid accuracy, so the trade is held where it is. Source:spectral_analysis/measure_bark.py,dsp/Reed.h. - Upper-partial cents drift in octave 6.The per-partial table shows the highest octave’s upper harmonics (k4–k6 around C6/D6) wandering tens of cents off in the reference itself — those partials sit near Nyquist and are noisy to estimate. The model stays close on k1–k3 there but cannot meaningfully chase the reference’s scattered top partials in octave 6. Source:
spectral_analysis/spectral_match_summary.txt(Octave 6 rows).
If a number on this page ever drifts from the script output, the script is the source of truth — not the copy.